

How to Build a 2027 Digital Marketing Budget for Mid-Size and Large Companies (with a Worked Example)



By Bagas · Updated November 3, 2026
A 2027 marketing budget you can defend to the board is calculated backwards from the target: how many new customers you need, how many leads and clicks it takes to win them, and what customer acquisition cost (CAC) still pays back. A share of revenue is only useful as a final check.
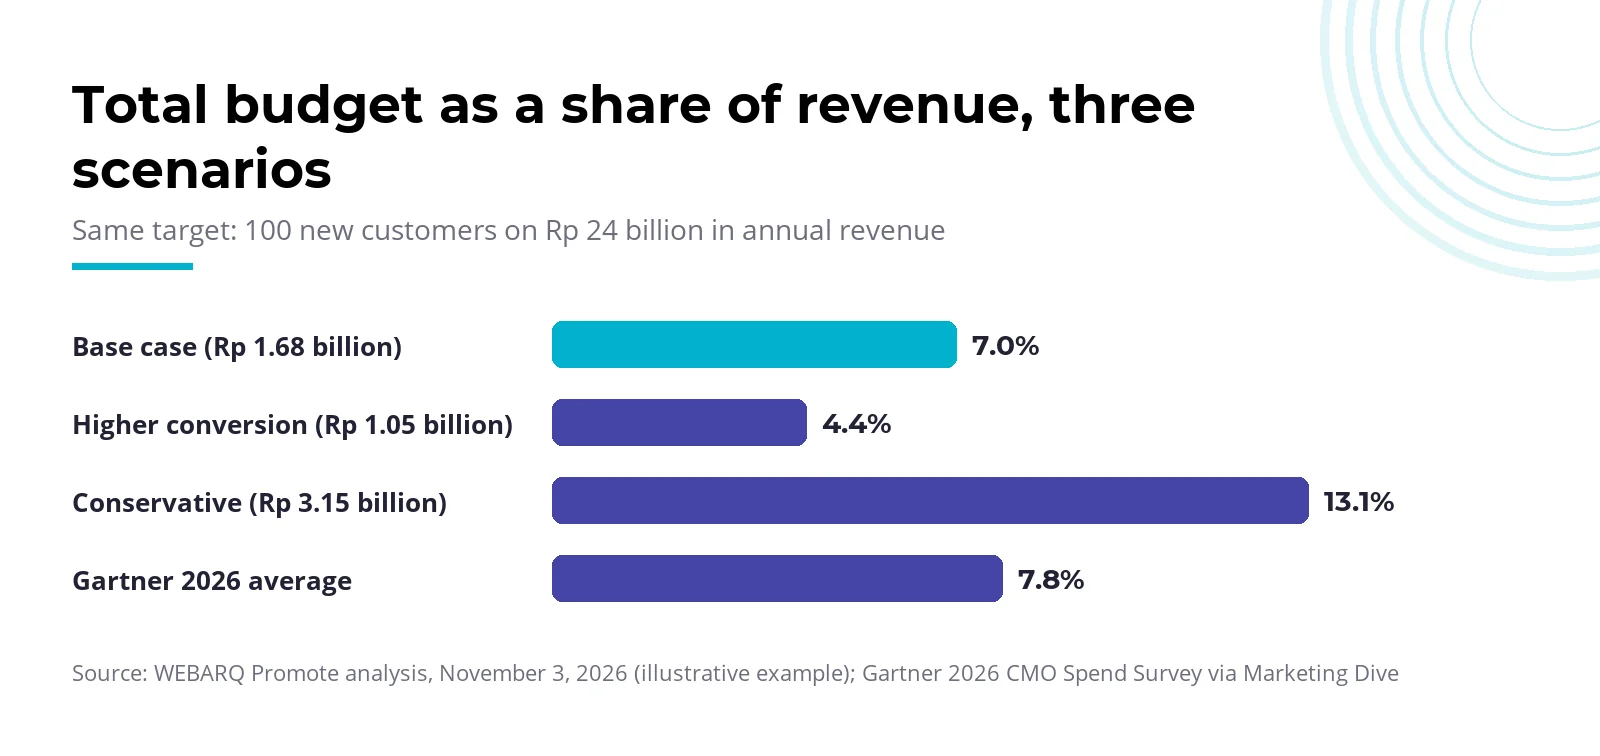
The most quoted benchmark, 7.8% of revenue in Gartner's 2026 survey, comes from large companies in North America and Europe. In the worked example below, an illustrative company earning Rp 2 billion a month could need 4.4% or 13.1% of revenue. The only difference is conversion rates.
Key takeaways
- Build the budget from the target: new customers equal extra revenue divided by revenue per customer, then work back to leads, clicks and media cost.
- For a company with Rp 24 billion in annual revenue aiming for 25% growth, the base-case total budget is Rp 1.68 billion (7.0% of revenue). The conservative case needs Rp 3.15 billion and breaks the CAC limit.
- Ring-fence a 10–20% test reserve as its own line. That range is our working judgment, not an industry standard.
- As of November 2026, Google Ads can spend up to 2 times the average daily budget on a given day, but never bills more than 30.4 times it in a month.
- Across 29 keywords we pulled from DataForSEO, the median CPC for B2B services was US$1.50 per click, about 4.8 times the consumer group (US$0.31).
What is a reasonable marketing budget, and why isn't a revenue percentage enough?
No single figure is reasonable for every company. The most quoted benchmark, an average of 7.8% of revenue in 2026, comes from Gartner's CMO survey as reported by Marketing Dive, which polled 401 CMOs and marketing leaders in North America, Europe and the UK.
Most respondents work at companies with over US$1 billion in annual revenue. The figure barely moved from 7.7% in 2025. Marketing Dive describes budgets as relatively flat.
The same data exposes the weakness. 56% of CMOs in that survey said they lacked the budget to execute their 2026 strategy, even at an average of 7.8%. A percentage can't tell you whether the money matches the target.
For Indonesia, we found no well-sourced percentage. The "7–9% of revenue" range that shows up in search results comes from a software vendor's blog, with no data we could trace.
When does a top-down budget still make sense?
A revenue percentage works if your category is stable, your channels haven't changed, and you have two to three years of CAC history. Then the percentage is a shortcut to a tested number.
It breaks down in three common situations. One is a product launch, with no conversion data yet. Another is B2B or BFSI with long sales cycles, where lead volume can rise while quality falls. The third is expansion into a new region.
That last one is concrete in Indonesia. The 2026 APJII survey counted 235.26 million internet users, or 81.7% of the population, but penetration is 85.95% in Java and 69.74% in Maluku and Papua. The same share of revenue won't buy the same result in both markets.
Which method should you use: top-down, bottom-up or objective-and-task?
For 2027, use objective-and-task as the main method, then check the result against a revenue percentage and competitor spend. The University of Minnesota's Principles of Marketing textbook (2015) lists four ways to set a promotion budget and calls objective-and-task the more rational and ideal one.
Objective-and-task is a method that starts from a measurable target, lists the activities needed, costs each one and adds them up. It's often called bottom-up.
| Method | How it works | Use it when | Main risk |
|---|---|---|---|
| Percent of revenue (top-down) | Budget = fixed share of last year's or forecast revenue | Mature category, stable channels, long CAC history | Ignores market shifts; the budget shrinks when revenue falls, exactly when it may need a push |
| Affordable | Spend what you feel you can afford | Rarely, for a company with a growth target | Tends to run short and has no link to outcomes |
| Competitive parity | Spend at the level of competitors | As a sanity check in ad-heavy categories | Rivals have different margins, targets and efficiency |
| Objective-and-task (bottom-up) | Target, then activities, then cost per activity, then total | New products, B2B/BFSI, expansion, board reviews | Needs honest conversion assumptions; optimistic ones produce a budget that's too small |
HBS Online (August 2025) cautions that no attribution model, from first-click to position-based, captures how consumers actually behave, so pair the method with experiments. Our piece on what performance marketing is covers the metrics used at each stage.
How do you calculate a budget from a target? A company earning Rp 2 billion a month
Turn the extra revenue into a number of new customers, then work back to leads, clicks and media cost. Then check that the CAC still pays back within your chosen period.
The example below is WEBARQ Promote analysis, November 3, 2026: an illustrative company, not a client. Every input is an assumption; replace it with your own data.
The assumptions
| Input | Value | Note |
|---|---|---|
| Current revenue | Rp 2 billion a month (Rp 24 billion a year) | Starting point |
| 2027 target | 25% growth, or Rp 6 billion in extra revenue | Assumption |
| Revenue per new customer in 12 months | Rp 60 million | Assumption |
| Gross margin | 40% | Assumption |
| Blended CPC | Rp 15,000 | Assumption, not a benchmark; replace with your account data |
| Test reserve | 15% of total budget | Mid-point of the 10–20% working range |
| Split of the remaining 85% | Paid media 70%, SEO and content 12%, measurement and tools 6%, agency fee 12% | Assumption; marketplace and retail media sit inside paid media |
From target to allowable CAC
Rp 6 billion in extra revenue divided by Rp 60 million per customer means you need 100 new customers. At a 40% margin, each one contributes Rp 24 million in gross profit in the first year.
Fully loaded CAC is total acquisition cost (media, content, tools, agency fee and test reserve) divided by the number of new customers. If the board wants payback within 12 months, fully loaded CAC can't exceed Rp 24 million per customer.
From CAC to media budget
Leads = customers ÷ lead-to-customer rate. Clicks = leads ÷ click-to-lead rate. Media = clicks × CPC. Total budget = media ÷ 0.70 ÷ 0.85.
All three scenarios keep the 100-customer target and the same CPC; only conversion assumptions change. So "aggressive" here means better conversion assumptions, which need a smaller budget.
| Conservative | Base | Aggressive (higher conversion) | |
|---|---|---|---|
| Click to lead | 2% | 3% | 4% |
| Lead to customer | 4% | 5% | 6% |
| Leads needed | 2,500 | 2,000 | 1,667 |
| Clicks needed | 125,000 | 66,667 | 41,667 |
| Paid media | Rp 1.875 billion | Rp 1 billion | Rp 625 million |
| Total budget per year | Rp 3.15 billion | Rp 1.68 billion | Rp 1.05 billion |
| Total budget per month | Rp 262.6 million | Rp 140.1 million | Rp 87.5 million |
| Share of Rp 24 billion revenue | 13.1% | 7.0% | 4.4% |
| Cost per lead (fully loaded) | Rp 1.26 million | Rp 840,336 | Rp 630,252 |
| Fully loaded CAC | Rp 31.5 million | Rp 16.8 million | Rp 10.5 million |
| Payback | 15.8 months | 8.4 months | 5.3 months |
| Below the Rp 24 million CAC limit? | No | Yes | Yes |
The base case lands at 7.0% of revenue, near Gartner's figure, by coincidence of arithmetic.
The more useful lesson sits in the conservative column. With lower conversion rates, the same company needs 13.1% of revenue and takes 15.8 months to pay back, past the 12-month limit. You have three options: raise conversion rates (for example with a better lead-generation landing page), lower the target, or ask the board to accept a longer payback.
The math is deliberately cautious: every click counts as paid, and SEO contributes zero leads.
How much should you set aside for test-and-learn?
Set aside 10–20% of the total budget as a separate line with its own rules. That range is our working judgment, not an industry standard: we found no authoritative general figure, and blogs quote anything from 5% to 20%.
The one reference point comes from Google itself. In its experiment playbook on Think with Google APAC (March 2022), Google says it reserves 20–30% of its own campaign budgets for testing before scaling. That's one very large company's practice, not a benchmark.
In the base case, 15% is Rp 252.1 million a year, about Rp 21 million a month. Spend it on open questions: a new format, region, landing page or platform feature.
AI Max for Search campaigns is a good example. As of November 2026, Google claims advertisers who turn it on usually get 14% more conversions or conversion value while CPA or ROAS stays about the same. That figure is Google's internal 2025 data for non-retail advertisers, so test it with reserve money instead of writing it into the forecast.
Three rules keep the reserve useful:
- Every test gets a hypothesis, success metric and end date, written down first.
- Unspent reserve doesn't flow automatically into running campaigns.
- A test that passes moves into the main budget at the next quarterly review, with its new numbers.
How should you allocate the budget across channels and the funnel?
Allocate after the total is set, not the other way round. In this example paid media gets 59.5% of the total, SEO and content 10.2%, measurement and tools 5.1%, agency fee 10.2% and the test reserve 15.0%, the same in every scenario.
| Line | Share of total | Conservative | Base | Aggressive |
|---|---|---|---|---|
| Paid media (Search, Social, marketplace) | 59.5% | Rp 1.875 billion | Rp 1 billion | Rp 625 million |
| SEO and content | 10.2% | Rp 321.4 million | Rp 171.4 million | Rp 107.1 million |
| Measurement and tools | 5.1% | Rp 160.7 million | Rp 85.7 million | Rp 53.6 million |
| Agency fee | 10.2% | Rp 321.4 million | Rp 171.4 million | Rp 107.1 million |
| Test reserve | 15.0% | Rp 472.7 million | Rp 252.1 million | Rp 157.6 million |
| Total | 100% | Rp 3.15 billion | Rp 1.68 billion | Rp 1.05 billion |
Inside paid media, follow existing demand: Search captures people already looking, while Social and video build demand that doesn't exist yet. Marketplace sellers also fund retail media from this line. The e-Conomy SEA 2025 report puts Southeast Asian retail media at US$3 billion, a regional figure, not Indonesia's.
For monthly media planning, Rp 1 billion in media a year is about Rp 83.3 million a month. On Google Ads, divide the monthly figure by 30.4: Rp 50 million a month for Search becomes an average daily budget of about Rp 1.64 million.
Three platform rules belong in the plan, as of November 2026:
- Google Ads: a campaign can spend up to 2 times its average daily budget on a given day, but monthly billing never exceeds 30.4 times it.
- Ad schedules: since June 1, 2026, campaigns switched off on certain weekdays are still paced toward the full monthly limit. Google's example: a US$100 daily budget with 20 active days now paces toward US$3,040 a month, so lower the daily budget if the monthly target is fixed.
- Meta: on a given day spend can run 75% above the daily budget, but the weekly total stays at no more than 7 times the daily budget. Meta advises a budget that can run for at least seven days so the system can learn.
Performance Max has its own requirement. Google's developer documentation recommends a daily budget worth three or more times the target CPA. In the base case, media cost per lead is Rp 500,000 (Rp 15,000 ÷ 3%), so a Performance Max campaign optimizing for leads needs about Rp 1.5 million a day.
What does a click cost in Indonesia, and what does it mean for your budget?
In our data pull, the median average CPC was US$1.50 for B2B services, US$0.64 for BFSI and US$0.31 for consumer categories. These are Google Ads Keyword Planner estimates via DataForSEO as of November 3, 2026, in US dollars, and not a guaranteed price.
Method: WEBARQ Promote analysis, November 3, 2026, 30 queries, DataForSEO, location Indonesia, language Indonesian, three groups of 10 keywords. One keyword ("sekolah internasional jakarta") returned no data, leaving 29. We didn't convert to rupiah, as this research had no verified exchange rate. DataForSEO documents CPC in US dollars but gives no unit for the two bid fields. We read them as US dollars too, because they sit on the same scale as CPC; read as rupiah, a click would cost only a few rupiah.
| Group | n | Example keywords | Average CPC, median (min–max) | High top-of-page bid, median (min–max) |
|---|---|---|---|---|
| A. B2B services | 10 | jasa seo, software akuntansi, sewa kantor jakarta | US$1.50 (0.93–4.66) | US$1.61 (0.92–10.91) |
| B. BFSI | 10 | kpr, kta online, asuransi mobil, gadai bpkb | US$0.64 (0.29–4.07) | US$0.88 (0.33–6.08) |
| C. Consumer and retail | 9 | sofa minimalis, laptop gaming, paket umroh | US$0.31 (0.07–0.77) | US$0.34 (0.16–0.68) |
The two measures differ. Average CPC is what clicks cost historically; the high top-of-page bid estimates the 80th percentile of bids needed to show above the results, as the Google Ads API defines it. That's why some CPCs sit above the bid, such as "jasa seo" (US$1.74 against US$1.26).
So the example's 66,667 clicks cost very different amounts by sector. The Rp 15,000 CPC assumption isn't derived from this table; replace it with your account's actual CPC from the last 6–12 months and rerun the scenarios. If your account has no history, our Paid Search team can build per-keyword estimates before the budget is locked.
BFSI: a wide range
The low BFSI median hides a wide spread. Most keywords, such as "kpr" (mortgages), "kredit motor" and "asuransi jiwa", have high bids below US$1. Three sit far above: "kta online" (unsecured loans) up to US$6.08, "pinjaman multiguna" US$3.86, and "asuransi mobil" (car insurance) US$3.83, with an average CPC of US$4.07.
Banks, multifinance firms and insurers shouldn't use one blended CPC across products. Build scenarios per product, each with its own CPC and lead-to-customer rate. A single blended number makes the most expensive product look cheap and the cheapest one look expensive.
How do you present the budget to the board and lock it to metrics?
Bring three scenarios with their assumptions, not a single number. A board approves Rp 1.68 billion more easily when it sees the figure rests on 3% and 5% conversion rates, and what happens if they miss.
Build the presentation in four parts:
- The business target in revenue and new customers, not impressions or clicks.
- The assumptions table and three scenarios, including the one that fails the CAC limit.
- Triggers agreed up front: raise the budget 10–20% if fully loaded CAC stays below 70% of the limit for two months running; cut or reallocate if it stays above the limit for two months.
- A quarterly review schedule, when assumptions are replaced with actuals and passing tests move into the main budget.
Those trigger numbers are examples, not rules. Agree on them before campaigns start, so raising or cutting doesn't depend on the mood in the room.
Put the metrics where the board can read them without a walkthrough. Our article on a board-ready marketing dashboard in Looker Studio covers the layout and must-have metrics. On the finance side, show media cost before and after tax, and work out VAT (PPN) under the current rules with your tax team.
Which mistakes most often throw a 2027 budget off?
The costliest one is setting the number first and justifying it later. The rest mostly follow:
- Measuring leads, not customers. A cost per lead of Rp 840,336 looks healthy, but means little if the lead-to-customer rate drops from 5% to 4%.
- Folding the test reserve into the running budget. It gets spent on existing campaigns, and next year you know no more than you do now.
- Setting daily budgets without looking at the monthly cap. With an ad schedule that switches off weekends, an old daily budget can now spend more than the monthly plan.
- Forgetting non-media costs. Content, tools and agency fees add up to 25.5% of the total in this example.
Frequently asked questions
What is an ideal marketing budget for a company?
It's the amount that wins your target number of new customers at a CAC below your payback limit. Divide extra revenue by revenue per customer, then work back through leads, clicks and media cost. For an illustrative company with Rp 24 billion in annual revenue, that gives Rp 1.05 billion to Rp 3.15 billion, depending on conversion rates.
What percentage of revenue do companies spend on marketing?
Gartner's 2026 CMO Spend Survey, as reported by Marketing Dive, puts the average at 7.8% of revenue, up slightly from 7.7% in 2025. The 401 respondents were mostly at North American, European and UK companies with revenue above US$1 billion. Use it as a sanity check, not as the basis for an Indonesian budget.
What is the minimum budget for Google Ads?
We found no official minimum that covers every campaign type. For Performance Max, Google's developer documentation recommends a daily budget worth three or more times the target CPA. With a Rp 500,000 target cost per lead, that's about Rp 1.5 million a day. Monthly billing never exceeds 30.4 times the average daily budget.
What is the objective-and-task budgeting method?
Objective-and-task starts from the goal, not the money available. You set a measurable target, list the activities needed, cost each one and add them up. A University of Minnesota marketing textbook calls it the more rational and ideal approach, because every rupiah ties back to a checkable outcome.
How often should a marketing budget be revised?
Review it every quarter against the assumptions you took to the board, especially conversion rates and CPC. Revise sooner if fully loaded CAC stays above your payback limit for two months running. Mid-month, mind the platform caps: 30.4 times the average daily budget per month on Google, seven times the daily budget per week on Meta.
Want to test your 2027 budget assumptions against real account data? The WEBARQ Promote Performance Marketing team can build the three scenarios with you, complete with a CAC limit and review triggers.