

A High ROAS Doesn't Mean Profit: How to Read ROAS, CAC and LTV Together



By Bagas · Updated November 18, 2026
ROAS (return on ad spend) is the revenue your ads bring in divided by what they cost. It is not profit. With a 15% contribution margin, Rp 1 million of ad spend that brings in Rp 5 million (a ROAS of 5) leaves only Rp 750,000 of margin, so you lose Rp 250,000 before any fixed costs.
Most answers to "what is ROAS" stop at the definition. What few people calculate is the number you decide on: break-even ROAS, followed by CAC, LTV and payback for businesses whose customers come back. Every example below is a WEBARQ Promote worked model dated November 18, 2026, built on hypothetical figures, not client results.
Key takeaways
- Break-even ROAS = 1 ÷ contribution margin. A 40% margin breaks even at a ROAS of 2.5; a 15% margin needs 6.67.
- At a 15% margin, a ROAS of 6 still loses Rp 100,000 for every Rp 1 million of ad spend.
- Target ROAS for a profit goal = 1 ÷ (contribution margin − target profit margin). A 40% margin with a 10% profit target needs a ROAS of 3.33.
- If customers buy again, judge campaigns by CAC payback and margin-based LTV:CAC, not first-order ROAS.
- Ask for new-customer ROAS, split out from retargeting and brand search. In our illustration a blended ROAS of 7.6 hides a new-customer ROAS of 1.6.
What is ROAS, and what does it leave out?
ROAS is revenue or conversion value from ads divided by ad cost. The formula is ROAS = ad revenue ÷ ad spend. Cost of goods, marketplace fees, shipping subsidies and returns aren't deducted at all.
Google, Meta and Shopee all work on that basis. Shopee's Seller Education Hub (article dated August 21, 2026) gives the example of Rp 3,000,000 in revenue from Rp 600,000 in cost, a ROAS of 5, and shows ACOS as the inverse (20%). Google defines Target ROAS as the average conversion value, such as revenue, you want per unit of ad spend; a 500% target means conversion value five times the cost. Meta calculates purchase ROAS as purchase conversion value divided by amount spent. All per each platform's documentation, accessed November 18, 2026.
ROI is a different measure. It compares profit after costs with the investment. The popular line "a ROAS of 1 means break-even" only holds if your margin is 100%, and almost no physical product works that way.
Platform ROAS vs blended ROAS (MER)
The ROAS in your Google, Meta or Shopee dashboard is that platform's count of conversions it attributes to its own ads. Some practitioners use a rougher but more honest check, MER (marketing efficiency ratio): total business revenue divided by total marketing spend across every channel. Each platform applies its own attribution window, so the revenue in all your dashboards added up won't necessarily match the revenue in your sales system. When the gap is large, trust the sales system.
Why can a ROAS of 5 still lose money?
A ROAS of 5 can lose money because ad profit comes from margin, not revenue: profit = revenue × contribution margin − ad spend. Whenever contribution margin is below 20%, revenue of five times ad spend doesn't even cover the ad spend.
Contribution margin is the selling price minus every variable cost per sale: cost of goods sold (COGS), marketplace and payment fees, shipping subsidy, and returns and refunds. Fixed costs such as team salaries and warehouse rent aren't in it yet. That makes the break-even points below a floor, not a target.
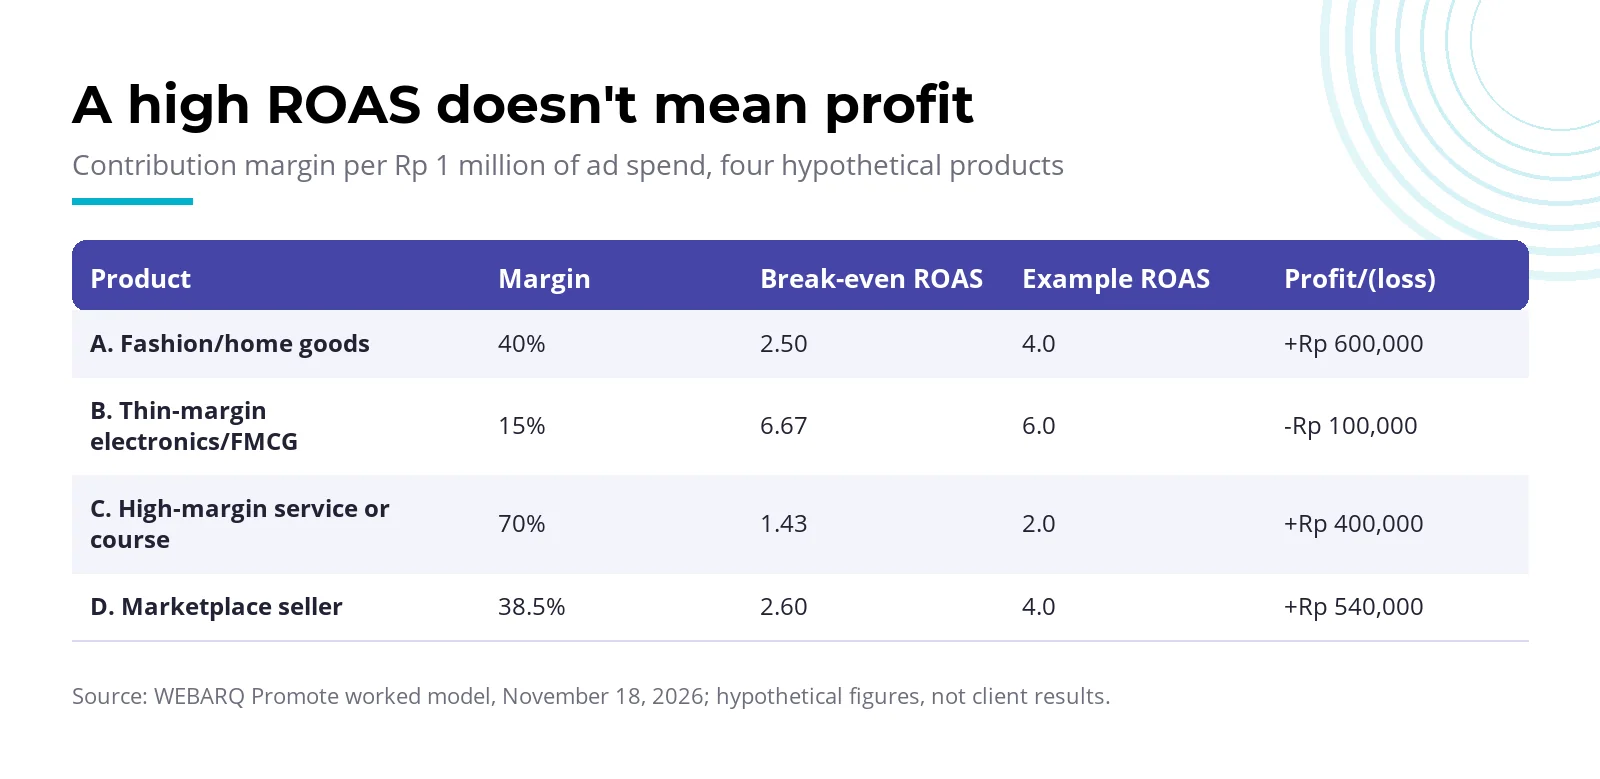
The table uses four hypothetical products, each with Rp 1,000,000 of ad spend.
| Product (hypothetical) | Contribution margin | Break-even ROAS | Example ROAS | Revenue per Rp 1M of ads | Profit/(loss) per Rp 1M of ads |
|---|---|---|---|---|---|
| A. Fashion/home goods, AOV Rp 500,000 | 40% | 2.50 | 4.0 | Rp 4,000,000 | +Rp 600,000 |
| B. Thin-margin electronics/FMCG | 15% | 6.67 | 6.0 | Rp 6,000,000 | −Rp 100,000 |
| C. High-margin service or course | 70% | 1.43 | 2.0 | Rp 2,000,000 | +Rp 400,000 |
| D. Marketplace seller (breakdown below) | 38.5% | 2.60 | 4.0 | Rp 4,000,000 | +Rp 540,000 |
WEBARQ Promote worked model, November 18, 2026; hypothetical figures, not client results.
Look at products B and C. A ROAS of 6 on B looks far better than a ROAS of 2 on C, yet B loses money and C makes Rp 400,000. Comparing ROAS across categories with different margins almost always misleads.
How do you calculate break-even ROAS and target ROAS?
Work out contribution margin per product or category, then divide 1 by it to get break-even ROAS. For a profit target, subtract the profit margin you want from contribution margin before dividing. Five formulas cover every calculation below:
- Ad profit = revenue × contribution margin − ad spend
- Break-even ROAS = 1 ÷ contribution margin
- Target ROAS for a profit goal = 1 ÷ (contribution margin − target profit margin)
- CAC = acquisition spend ÷ number of new customers
- LTV (margin basis) = AOV × contribution margin × orders per customer
What comes out of contribution margin?
For marketplace sellers, platform fees are the line most often forgotten. Product D in the table above starts from a Rp 500,000 price:
| Per-order item | Amount | Basis |
|---|---|---|
| Selling price | Rp 500,000 | Assumption |
| Cost of goods (45%) | −Rp 225,000 | Assumption |
| Shopee admin fee 8.25% | −Rp 41,250 | Example category rate (prayer wear and accessories) |
| Order processing fee | −Rp 1,250 | Per Bisnis.com, May 2026 |
| Shipping subsidy (3%) | −Rp 15,000 | Assumption |
| Returns and refunds (5%) | −Rp 25,000 | Assumption |
| Contribution margin | Rp 192,500 (38.5%) | Break-even ROAS 2.6 |
The 8.25% rate comes from Shopee's category breakdown for Non-Star and Star/Star+ sellers (page dated November 13, 2026). Per Shopee's admin fee page, dated November 16, 2026, rates run from 2.5% to 10% by category, are charged on the original price minus any discounts or vouchers the seller funds, and exclude the order processing fee, payment fee and any program fees you sign up for. The Rp 1,250 per completed order comes from a Bisnis.com report from May 2026. Rates change often, so check your own category before using any of these numbers.
One more cost sits outside ROAS. Shopee adds 11% VAT when you buy ad balance, so Rp 100,000 of balance costs Rp 111,000. If your ROAS is read against the balance before VAT, product D's effective break-even ROAS rises from 2.6 to about 2.9 (our calculation, 1.11 ÷ 0.385, as an illustration). Optional program fees such as Gratis Ongkir XTRA aren't included and would push it higher still.
Target ROAS when you want a profit
Break-even is rarely the goal. With a 40% contribution margin and a goal of keeping 10% of revenue as profit, target ROAS is 1 ÷ (0.40 − 0.10) = 3.33. A 15% profit target lifts it to 4.00. For a thin-margin product (15%) with a 5% profit target, target ROAS becomes 10, higher than any example ROAS in the first table. A result like that tells you to fix pricing or bundling, not to add ad budget.
What is CAC, and why isn't ROAS the same thing?
CAC (customer acquisition cost) is what it costs to win one new customer: acquisition spend divided by new customers in the same period. ROAS mixes purchases by new and existing customers in one number, so it can't tell you what you're paying to grow the customer base.
The problem is sharpest when much of the budget goes to retargeting and brand search. People who already know your brand buy more easily, so a high ROAS there is expected. The illustration below uses Rp 100 million of spend and a 30% contribution margin (break-even ROAS 3.33).
| Segment (hypothetical) | Spend | Revenue | ROAS | Profit/(loss) at 30% margin |
|---|---|---|---|---|
| Retargeting + brand search (40% of spend) | Rp 40 million | Rp 600 million | 15.0 | +Rp 140 million |
| Prospecting, new customers (60% of spend) | Rp 60 million | Rp 160 million | 2.67 | −Rp 12 million |
| Blended | Rp 100 million | Rp 760 million | 7.60 | +Rp 128 million |
| New-customer revenue over total spend | Rp 100 million | Rp 160 million | 1.60 | Below break-even of 3.33 |
WEBARQ Promote worked model, November 18, 2026; hypothetical figures, not client results.
A report headlined "ROAS 7.6" sounds healthy. Yet each rupiah of ads brings in only Rp 1.60 of revenue from new customers, and prospecting on its own still loses money. One caveat matters: the Rp 140 million retargeting profit in that table assumes all of its revenue happened because of the ads. ROAS can't prove that, since some of those buyers would likely have purchased anyway. Measuring the true lift takes a holdout or lift test.
The platforms do give you a lever here. Google Ads offers customer lifecycle goals, including a new customer acquisition setting that works in Search, Shopping, Demand Gen and Performance Max campaigns (per Google Ads documentation, November 2026). Asking your team to "split out new-customer results" isn't an impossible request.
What is LTV, and when is it fine to lose money on the first order?
LTV (lifetime value) is the total margin one customer brings in over the whole time they buy from you. Calculate it on margin, not revenue: AOV × contribution margin × number of orders. Losing money on the first order is acceptable when repeat purchases show up in your CRM data and your cash can wait for CAC to come back.
The example uses an AOV of Rp 500,000, a 30% contribution margin (Rp 150,000 per order) and a CAC of Rp 300,000.
| Measure | Value |
|---|---|
| CAC | Rp 300,000 |
| First-order margin | Rp 150,000, still Rp 150,000 short of CAC |
| Cumulative margin after order 1 / 2 / 3 / 4 | Rp 150,000 / Rp 300,000 / Rp 450,000 / Rp 600,000 |
| LTV, margin basis (4 orders) | Rp 600,000 |
| LTV:CAC | 2.0 |
| Payback | Exactly at order 2 |
| Lifetime profit after CAC | Rp 300,000 per customer |
| First-order ROAS | 1.67, below break-even of 3.33 |
WEBARQ Promote worked model, November 18, 2026; hypothetical figures, not client results. The three repeat orders are an assumption.
The same business gives two answers. Judged by first-order ROAS, the campaign loses money (1.67 against 3.33) and should be stopped. Judged by payback, CAC comes back on the second order and each customer leaves Rp 300,000 after four orders. The second answer only holds if those three repeat orders really happen, and that has to be proven from your own purchase data, not from a slide assumption.
The LTV:CAC ratio
A 3:1 ratio is a common rule of thumb in SaaS, associated with David Skok. In a 2017 post, Skok uses 3:1 as an example target, warns that ratios like this are to be used rather than believed, and says they only become reliable once your way of selling is repeatable. The 2.0 ratio in the example sits below that marker. That doesn't make it bad by default, but it does call for a deliberate decision on how long you're willing to wait.
Payback period
Payback period is the number of months or orders until a customer's cumulative margin covers their CAC. In the same post, Skok calls months to recover CAC a more powerful metric at an early stage, and in his SaaS sales example suggests keeping it under 12 months. For retail in Indonesia the practical question is this: if the second order comes three months later on average, can your cash carry the first-order loss on every new customer for those three months?
When is ROAS still useful, and when shouldn't you trust it?
ROAS is still useful for comparing campaigns that sell products with similar margins, for one-off sales with high margins, and as a bidding signal. It deserves much less trust when retargeting and brand search take a large share of spend, when attribution includes view windows, or when part of the number is platform modeling.
Two examples from platform documentation. For GMV Max ads, Shopee counts purchases within 7 days of a click and also checkouts within 24 hours of someone merely seeing the ad. Meta says purchase ROAS may be partly modeled or estimated, and for some iOS 14+ results may not be calculated at all. Both are legitimate methods, but the number is still each platform's estimate of its own results.
The most direct way to make bidding chase profit is to change the value you send. Google says conversion value can be revenue or profit margin, and Target ROAS optimizes whatever number you pass. Conversion value rules can raise or lower values by audience, location or device. Cost-of-goods data in Merchant Center unlocks profit reporting, but the documentation describes it for reporting only, not bidding. On Meta, the ROAS goal works with the purchase value your pixel or SDK sends, and Meta says it performs best at 50–100 conversions a week.
Two more notes from the same documentation. Google's Target ROAS on Search and Shopping needs at least 15 conversions in the last 30 days, with values above zero. Shopee advises setting target ROAS no more than 25% above its recommendation, since a target that's too high can cut volume. We covered choosing a bid strategy in our guide to Google Ads Smart Bidding for lead generation, and getting more complete conversion data in our server-side tracking and Conversions API guide.
What should you ask your team or agency before raising budget?
Ask for numbers you can turn into profit, not just ROAS. These five questions are enough for a monthly review, and the answers decide whether budget goes up, stays flat or moves.
- What is the contribution margin per category, and what are the break-even and target ROAS for each?
- What are the ROAS and CAC for new customers, split out from retargeting and brand search?
- What is CAC payback in months, based on repeat-purchase data from the CRM or sales system?
- Is the conversion value sent to Google or Meta revenue or margin, and when was it last checked?
- How far apart are ad-dashboard revenue and sales-system revenue this month?
A useful monthly report carries all five per channel, plus MER for the business as a whole. If your team can't answer questions 2 and 3 yet, the first job is tracking, not a bigger budget. To fold these numbers into an annual plan, our worked example of a 2027 marketing budget uses the same approach. If ROAS and ROI still get treated as one thing, our explainer on performance marketing covers the measurement basics.
Frequently asked questions
What is a good ROAS?
No single number fits every business, and we found no official benchmark for Indonesia. Your floor is 1 divided by your contribution margin: a 40% margin breaks even at 2.5, a 15% margin at 6.67. To build in profit, use 1 divided by (contribution margin minus your target profit margin).
What's the difference between ROAS and ROI?
ROAS compares revenue with ad cost only. ROI compares profit, after cost of goods, fees, shipping and returns, with the total investment. So a campaign with a high ROAS can still post a negative ROI when the product's margin is thin. For budget decisions, convert ROAS into profit using contribution margin.
How does Shopee calculate ROAS?
Shopee treats ROAS as ad revenue divided by ad cost, with the example of Rp 3,000,000 from Rp 600,000 giving a ROAS of 5. For GMV Max, purchases within 7 days of a click and checkouts within 24 hours of a view both count. Admin fees, the order processing fee and the 11% VAT on ad balance aren't part of that figure.
What's the difference between CAC and CPA?
CAC is the cost per new customer, calculated as acquisition spend divided by the number of new customers. CPA is the cost per any conversion you define, including purchases by existing customers or form fills. A CPA that looks cheap can hide an expensive CAC when most conversions come from people who were already buying from you.
What is a good LTV:CAC ratio?
A 3:1 ratio is often used as a SaaS rule of thumb and is associated with David Skok, who wrote it as an example target rather than a standard. For a business in Indonesia, calculate LTV on margin, then check payback: how many orders or months until CAC comes back, and whether your cash can wait that long.
Want to know the break-even ROAS for each of your categories and what a new customer really costs? Our Performance Marketing team can build those numbers from your sales data before the next budget decision.