

Omnichannel Marketing for Retail Brands: Balancing Marketplaces, Your Own Store and Physical Stores



By Della · Updated November 16, 2026
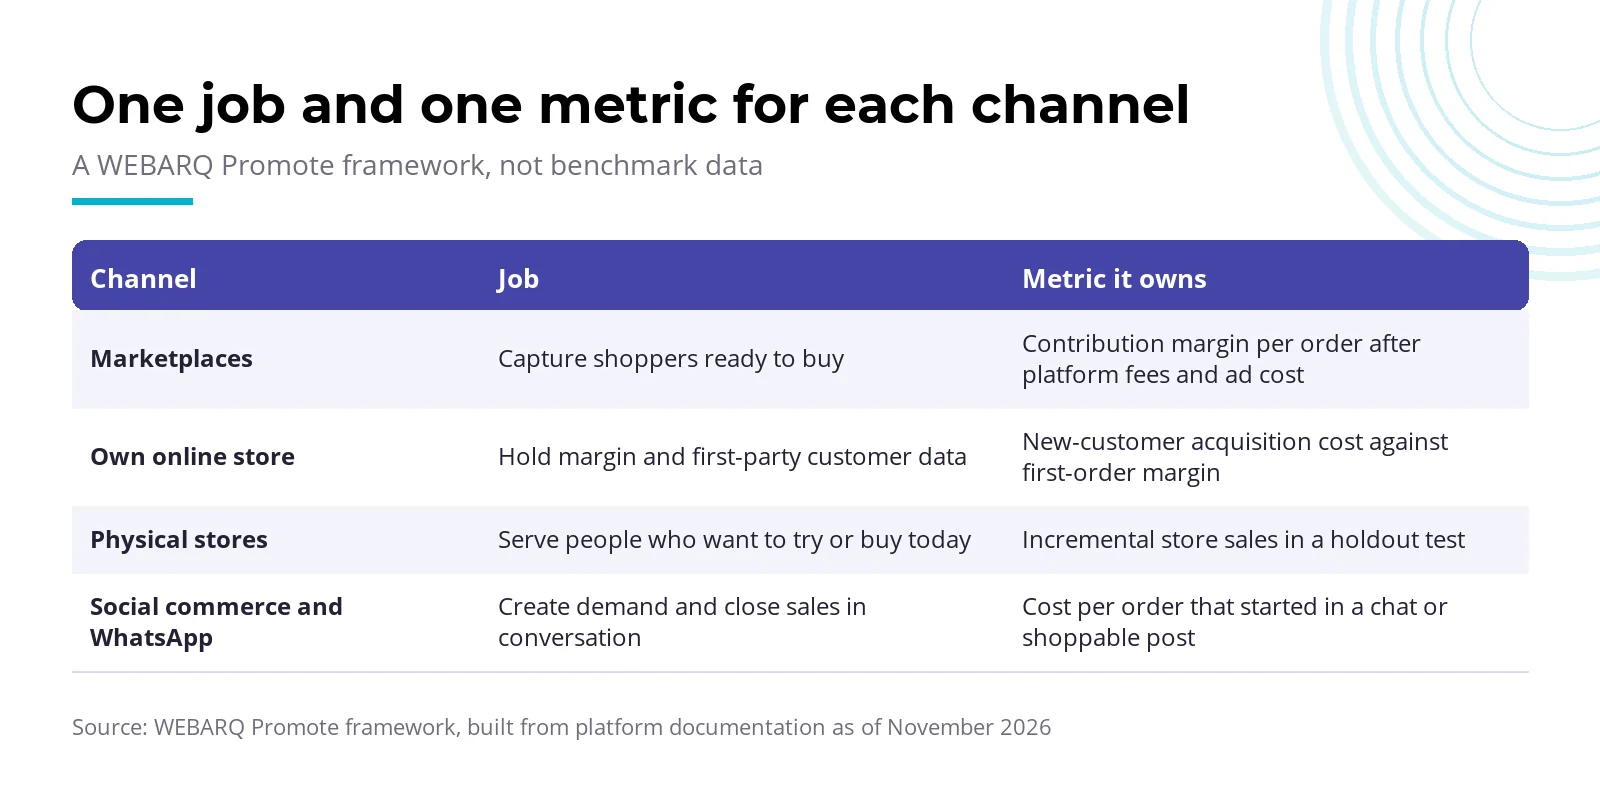
For a retail brand, omnichannel marketing means giving marketplaces, your own online store, physical stores and social commerce one job and one metric each, then reading them through a single view of the customer. Without that split, every channel claims the same sale and nobody can explain the growing ad budget to the board.
The market is big enough to justify the effort. The e-Conomy SEA 2026 Indonesia report from Google, Temasek and Bain projects Indonesian e-commerce GMV at US$85 billion in 2026, up 16% from US$73 billion in 2025. We summarized the rest of the report in five key numbers from e-Conomy SEA 2026.
Key takeaways
- Give each channel one job: marketplaces capture ready-to-buy shoppers, your own store holds margin and data, physical stores serve people who want to try first, and social commerce and WhatsApp close sales in chat.
- One metric per channel, and drop misleading ones: TikTok Shop's GMV Max dashboard, for example, credits organic and affiliate orders to the ads, so its ROAS doesn't measure extra sales.
- Build the budget for each sales stage from stock and margin. In an illustrative Rp 1 billion month, 8,000 units of stock times a maximum ad cost of Rp 50,000 per unit caps conversion spend at Rp 400 million.
- Store visits in Google Ads are a modeled estimate. To prove that online ads move store sales, run a four-week geo holdout read from point-of-sale (POS) data.
How is omnichannel different from simply being on many channels?
According to Wharton Executive Education, omnichannel marketing is one strategy that treats every channel, online and offline, as part of the same customer journey, and starts from the customer rather than the channel. Multichannel builds a separate presence on each platform.
Here's a quick test. If your Shopee price differs from your own store's, the WhatsApp team doesn't know about the in-store promotion, and every channel keeps its own customer list, you're still multichannel. That's not a sin, but you can't split an ad budget sensibly until each channel has a clear role.
What role should each channel play?
Each channel should own one job and one metric, plus one metric you stop using as proof of success. The table below is a WEBARQ Promote framework, not benchmark data: our recommendation, built from platform documentation as of November 2026.
| Channel | Job | Metric it owns | Stop using as proof | Main risk |
|---|---|---|---|---|
| Marketplaces (Shopee, Tokopedia, Lazada, Blibli, Zalora) | Capture shoppers already in the platform and ready to buy | Contribution margin per order after platform fees and ad cost | Platform-reported ROAS or GMV | Platform holds customer data and pricing; price wars; stock and promo sync |
| Own online store | Hold margin and first-party customer data | New-customer acquisition cost against first-order margin | Sessions and last-click ROAS alone | Little traffic without paid media; consent discipline for CRM |
| Physical stores | Serve people who want to touch, try or buy today; pickup and returns | Incremental store sales in a holdout test | Store-visit counts and raw footfall | Store-sales tools have high thresholds |
| Social commerce and WhatsApp | Create demand and close sales in conversation | Cost per order that started in a chat or shoppable post | Impressions, clicks, in-platform attributed GMV | Customer-service capacity; per-message pricing rules that change |
Marketplaces: a sales channel, not a brand data asset
Shoppers who know what they want are on marketplaces, so be there. But the platform owns the customer data and the rules.
The bigger problem is measurement. According to TikTok's documentation on Product GMV Max (read November 16, 2026), all orders for an advertised product are attributed to GMV Max, including orders from organic content and affiliates. So dashboard ROAS includes sales that would partly have happened anyway. Use contribution margin per order after fees and ad cost instead.
Channels also overlap. Since June 11, 2025, Tokopedia and TikTok Shop have shared one Seller Center: one stock pool, two storefronts, and two ad channels that can claim the same order.
Your own store: margin and data, but no traffic
Your own store gives you margin without platform fees and a customer list you can contact again. Its weakness: almost no traffic arrives on its own. Budget for ads and SEO from the start, or don't expect it to become a main channel.
The sensible metric is customer acquisition cost (CAC) against first-order contribution margin. The customer list feeds retention and retargeting, where Indonesia's Personal Data Protection Law, UU No. 27 of 2022, applies. Processing needs a legal basis such as explicit consent for a specific purpose (Article 20). Consent must be written or recorded and clearly separated from other matters (Article 22), and people may withdraw it (Article 9). A promotions-consent checkbox kept apart from the purchase terms is a reasonable start. (This section is general information, not legal advice.)
Physical stores: judged on incremental sales, not visits
Physical stores serve people who want to try a product or take it home today, and double as pickup and return points. A well-kept Google listing is the foundation, covered in managing Google Business Profile for multiple locations.
Store visits are modeled, so they aren't proof of sales.
Social commerce and WhatsApp: demand and conversation
Social commerce (TikTok Shop, Instagram, click-to-WhatsApp ads) creates demand through content and closes sales in chat. Judge it on cost per order that started in a conversation or a shoppable post.
Budget for WhatsApp costs too. Per the WhatsApp Business Platform pricing page (read November 16, 2026), Meta has charged per message since July 1, 2025, by message category and the recipient's country code. Indonesia (+62) is on the rate card, and each business number gets 1,000 free service messages a month. The other risk is operational: chats that pile up unanswered on a busy campaign day.
How much ad budget should each sales stage get?
Size each stage from stock, margin and consented customers, not borrowed percentages. This example is an illustration, not a benchmark: every number is assumed, with Rp 1 billion of ad budget in a peak month.
Conversion: a ceiling set by stock and margin
Assume an average price of Rp 250,000 and a 40% gross margin: Rp 100,000 per unit before ads. You'll spend half of that, Rp 50,000 per unit, on ads. That's 20% of revenue, so break-even under this rule is a ROAS of 5.0x (Rp 250,000 divided by Rp 50,000).
Peak-month stock of your hero products is 8,000 units. Conversion ceiling: 8,000 × Rp 50,000 = Rp 400 million. Beyond that, you're buying clicks for products you don't have.
Retention: sized by the consented customer list
Take 40,000 customers with recorded consent at Rp 2,500 each per month for creative, messages and remarketing: Rp 100 million.
Awareness and consideration: the remainder
That leaves Rp 500 million. Split it by what you lack, new audiences or qualified visitors; here it's split evenly.
| Stage | Rp per month | Share of Rp 1 billion | How it's set |
|---|---|---|---|
| Awareness | Rp 250,000,000 | 25% | Remainder, split evenly in this example |
| Consideration | Rp 250,000,000 | 25% | Remainder, split evenly in this example |
| Conversion | Rp 400,000,000 | 40% | 8,000 units × Rp 50,000 |
| Retention | Rp 100,000,000 | 10% | 40,000 customers × Rp 2,500 |
| Total | Rp 1,000,000,000 | 100% |
The rule shows when stock falls short. If only 5,000 units arrive, the conversion ceiling drops to Rp 250 million. The freed Rp 150 million moves to awareness and consideration (say Rp 75 million each) or is held back. To set the total from your sales target and CAC, see our 2027 marketing budget worked example.
How do you prove that online ads drive store sales?
For most retail brands in Indonesia, the most dependable method is a geo holdout test you run yourself: some regions get extra ad spend, others don't, and you compare store sales from POS data.
Per Google's documentation (read November 16, 2026), store visits are an estimate: aggregated, anonymous data from signed-in users with location history on, extrapolated to the wider population and checked against a survey panel of more than 10 million Google Opinion Rewards volunteers. Indonesia is on the list of supported countries.
| Method | What it gives | Main requirements (November 2026) | Indonesia | Limit |
|---|---|---|---|---|
| Google store visits | Estimated visits, usable in Smart Bidding | Active location assets, verified locations, unpublished privacy thresholds | Supported | Modeled; recent days keep changing |
| Google store sales | Sales matched to ad interactions | Allowlist; about 300,000 store visits and over 500,000 ad interactions in 90 days | Counts and default values supported | Out of reach for most brands |
| Meta offline events via Conversions API | In-store purchases linked to ads | Events at most 7 days old when sent; upload within 62 days | Not stated | Needs POS data with email or phone, and consent |
| Meta Conversion Lift | User-level incremental sales (test vs holdout) | Limited access through a Meta rep; at least 100 conversions for breakdowns | Ask your Meta rep | Not by region |
| Geo holdout (self-run) | Incremental store sales by region | Ad spend and sales tracked per region | Not country-specific | Needs careful region design; spillover |
For Meta's omnichannel ads, the setup guide asks for an Offline Data Quality score of 8.5 or higher and daily uploads (at least 12 in the last 14 days). That's data work, covered in our server-side tracking and Conversions API guide.
A four-week geo holdout test
The method follows Google's paper on geo experiments by Vaver and Koehler (2011). The four-week length is our design choice, not the paper's.
- Pick comparable regions (cities or store catchments), group them by size, and randomly assign them to treatment and control. In Google's experience, grouping by size first narrowed the ROAS confidence interval by 10% or more.
- Run a four-week pretest, same treatment everywhere, as a baseline.
- For four test weeks, change ads only in treatment regions. No new stores or special promotions anywhere.
- Record POS sales and ad spend per region, plus a lag period after the test, since offline purchases come later.
- Incremental sales = treatment test sales minus treatment pretest sales adjusted by the control group's change.
With made-up numbers: in the pretest, treatment and control regions each sold Rp 2.0 billion. During the test, treatment sold Rp 2.5 billion and control Rp 2.1 billion (up 5% on seasonality). Expected treatment sales without extra ads: Rp 2.0 billion × 1.05 = Rp 2.1 billion. So Rp 0.4 billion is incremental, from Rp 100 million of extra spend: an incremental ROAS of 4.0x. The paper itself uses a linear regression; this ratio is a simplification.
Tell the board the limits up front: regions must be large because people cross borders, peak promotions can drown the signal, and one test is one reading.
Who owns page one of Google for retail products?
For price- and spec-driven product searches, marketplaces do. In WEBARQ Promote analysis, November 16, 2026, 20 queries, DataForSEO (location Indonesia, Indonesian language, desktop, top five organic results per query), marketplaces held 46 of 100 positions. Brand or retailer sites held 30, media and price aggregators 17, and user-generated and social content 7.
| Query type | Examples from the sample | Marketplaces in top five |
|---|---|---|
| Price and spec | sofa 3 dudukan, kasur springbed 160x200, baju olahraga wanita | 5 of 5 |
| Commodity products | kopi bubuk 1 kg, spidol warna set, lampu hias ruang tamu | 3 to 4 of 5 |
| Brand choice | jam tangan pria, tas kulit wanita, sandal pria | 1 of 5 |
| Advice and reviews | parfum lokal, pelembap wajah kulit berminyak | 0 to 1 of 5 |
At least one marketplace made the top five in 19 of the 20 queries. An AI Overview with content appeared for 10 of 20 queries, and 8 of the 9 whose sources we tallied cited at least one marketplace domain. Our reading: a brand without a marketplace storefront is nearly invisible in price-led searches; its own site wins when the buyer already knows the brand.
Limits: one day, one nationwide setting, desktop, 20 queries we chose. It shows who appears, not who sells more.
What can our retail and e-commerce campaigns teach?
These are ad or SEO campaign results, not store sales data.
- Faber-Castell: a Meta Ads Collaborative Campaign for marketplace sales. About 1.1 million impressions, around 11,000 clicks each month, and a 2.7X ROAS from the total campaign placement.
- Renos: Google Ads SEM, GDN, Performance Max and Meta Conversions, one platform per funnel stage. About 21 million impressions, around 385,000 clicks and about 1,300 conversions.
- Cellini Furniture: website traffic through Google Search, GDN, YouTube Ads and Performance Max. A CTR above 4%, around 2.2 million clicks, and CPC down 7% a month on average.
- Yava: SEO for organic traffic to its own site. 398% growth in organic traffic, and 88% reached Google's first page within 6 months.
Year-end readiness checklist
Six checks before you raise the peak-season budget.
| Area | What to check | Ready when |
|---|---|---|
| Stock | Stock sync across channels | Advertised products can't sell beyond stock |
| Price | Price and promotion parity across channels | Any price gap has a written reason |
| Tracking | Online and offline purchase events, one customer ID | POS data can be matched by region for a holdout test |
| Customer service | WhatsApp agents during the campaign | A reply-time target and a duty roster for promo days |
| Creative | Versions per channel: short video, catalog, WhatsApp messages | Each channel has adapted assets |
| Cut-off dates | Shipping, pickup and promotion dates | One calendar shared by ads, warehouse and store teams |
If you only have time for one, start with stock. Ads for sold-out products are the costliest waste of peak season.
Frequently asked questions
What is the difference between omnichannel and multichannel marketing?
Multichannel means being present on many channels, each run on its own. Omnichannel starts from the customer, with one strategy that treats every channel, online and offline, as one journey. The practical test for a retail brand: are stock, prices, promotions and customer data managed together, or does each channel keep its own version?
Should a retail brand start with marketplaces or its own online store?
For products people search by price and specification, start with marketplaces: in our study of 20 product queries in Indonesia, they held 46 of the 100 top-five Google positions. Build your own store in parallel for margin and customer data, with a realistic traffic budget from day one.
How much should a retail brand spend on ads?
There's no percentage benchmark you can safely borrow. Work from three rules: stock times maximum ad cost per unit caps conversion spend, the number of consented customers sizes retention, and awareness and consideration share the rest. Start from margin per unit, not from the total you'd like to spend.
How do you measure in-store sales from online ads?
Google Ads store visits are a modeled estimate, not a count. Store sales measurement needs allowlisting and around 300,000 store visits in 90 days, out of reach for most brands. The most dependable option is a geo holdout test: regions with and without extra ad spend, compared on point-of-sale data.
Do small businesses need an omnichannel strategy?
Yes, in a small form. Start with two channels, such as one marketplace and WhatsApp, and clean up stock and customer data before adding more. Before using a customer list for retargeting, make sure consent is recorded in line with Articles 20 to 22 of Indonesia's Personal Data Protection Law. This is general information, not legal advice.
Want to know which channel deserves the extra budget next peak season? Our Performance Marketing team at WEBARQ Promote can map the role of each of your channels and design a geo holdout test for store sales.