

e-Conomy SEA 2026: Five Indonesia Numbers Marketers Should Take Into the 2027 Budget



By Della · Updated November 14, 2026
Google, Temasek and Bain & Company's e-Conomy SEA 2026 report projects Indonesia's digital economy gross merchandise value (GMV) at US$119 billion in 2026, up 16%. That's the headline nearly every outlet ran. Two details got far less attention: the 2025 baseline was revised from US$99 billion to US$102 billion, and the fastest-growing sector is online media, not e-commerce.
Misread them, and your 2027 growth targets look easier than they are.
Key takeaways
- Indonesia's digital economy GMV is projected at US$119 billion in 2026 (+16%), about 32% of Southeast Asia's US$368 billion.
- E-commerce contributes US$85 billion, or 71% of the total, but grows 16%, slower than the regional 18%.
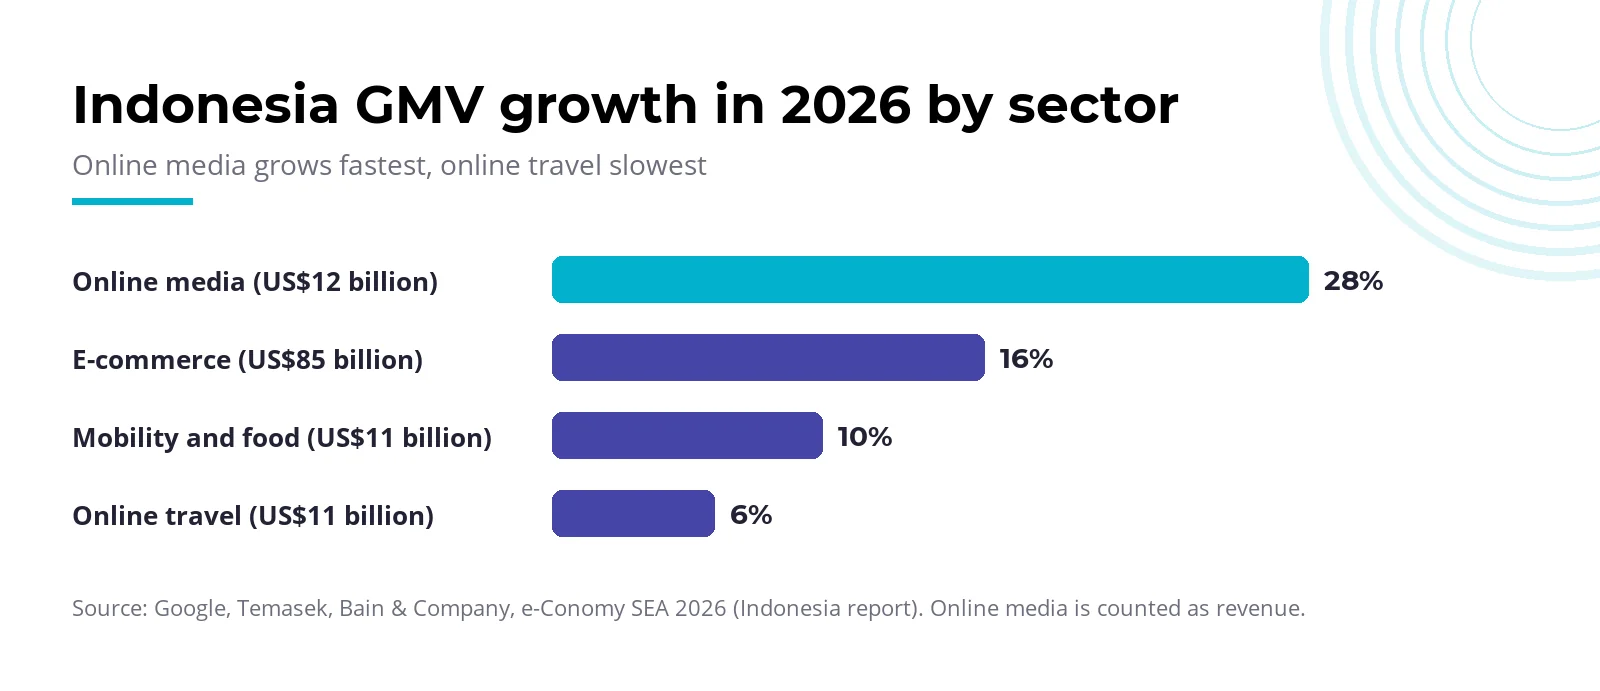
- Online media grows fastest (+28%, US$12 billion). That's media services revenue, not ad spend.
- The jump from US$99 billion (2025 edition) to US$119 billion isn't 20% growth, because the 2025 base was revised to US$102 billion.
What does the e-Conomy SEA 2026 report say about Indonesia?
e-Conomy SEA 2026 is the 11th edition of the annual Southeast Asia digital economy study by Google, Temasek and Bain & Company, released on October 21, 2026. It measures GMV across four sectors: e-commerce, online travel, online media, and mobility and food delivery.
Know its limits. According to the regional report, digital financial services (payments, lending, insurance) sit outside the GMV total because they use different units. E-commerce excludes informal commerce. Online media is counted as revenue.
Regionally, Google puts Southeast Asia's 2026 GMV at US$368 billion, up 17%. Indonesia's share is about 32% (our arithmetic). AI data comes from a Google and YouGov survey of 9,006 AI users in six markets (SEA-6), July 2026.
Five key Indonesia numbers vs the 2025 edition
Five numbers matter most for marketing plans: total GMV, e-commerce, online media, AI use and the slow-growing sectors. This table separates growth from revisions.
Method (WEBARQ Promote analysis, November 14, 2026): we read the 2026 Indonesia PDF (EN pages 3–8, ID pages 10–15) and the 2025 Indonesia PDF (EN pages 2–7), then checked every chart label against the page image. Values in US$ billion; shares are our arithmetic.
| # | Number | 2025 edition (2025 value) | 2026 edition | Note | Pages |
|---|---|---|---|---|---|
| 1 | Total GMV | 99 (+14%); 2030 range ~180–340 | 2025 revised to 102; 2026 119 (+16%); 2030 227 | Base up by 3; 2030 outlook now a single figure | 2025: p.3 · 2026: p.6 |
| 2 | E-commerce | 71 (+14%); 2030 ~140 | 2025 revised to 73; 2026 85 (+16%); 2030 175 | 71% of the 2026 total | 2025: p.3 · 2026: p.6 |
| 3 | Online media | 9; 2030 ~15 | 2025 unchanged at 9; 2026 12 (+28%); 2030 19 | Fastest sector, the only one not revised | 2025: p.3 · 2026: p.6 |
| 4 | AI use | Different survey (ASEAN-10, Sept 2025), not comparable | 54% of working population (105 million); ~1.8 sessions/week; 84% open to AI agents buying for them | New data point, not yet a trend | 2025: p.6 · 2026: pp.3–5 |
| 5 | Slow sectors and digital lending | Travel 10; mobility and food 9; lending 13 | Travel 11 (+6%); mobility and food 11 (+10%); lending 16 (+22%) | Lending growth down from +31% | 2025: pp.3–4 · 2026: pp.6–7 |
1. Total GMV: US$119 billion on a new base
Reported 2026 growth is 16% on the revised base, not 20%. The 2030 outlook moved from a wide range to US$227 billion, with US$446 billion added for 2035.
2. E-commerce: large, but trailing the region
At US$85 billion, Indonesia holds about 38% of Southeast Asia's US$226 billion e-commerce market. The region grows 18%, Indonesia 16%.
3. Online media: fastest, but not ad spend
Ads, gaming, video-on-demand and music all count here. The Indonesia report doesn't split the US$12 billion by sub-segment, so the advertising share is unknown.
4. AI: wide, but shallow
Some 54% of Indonesia's working population use generative AI, 47% weekly and 16% daily. Users average only about 1.8 sessions a week, the lowest in SEA-6. Indonesia has 43% of SEA-6 AI users but only 37% of total usage, measured in tokens.
5. Travel, mobility and digital lending
Online travel (+6%) and mobility and food (+10%) grow slower than the region (+10% and +15%). Digital lending rises to US$16 billion, but growth slows from 31% to 22%.
What do these numbers mean for your 2027 marketing budget?
Use these numbers as a sanity check on targets, not a reason to spend more. If your plan assumes online sales growing well above 16%, the gap must come from taking share, at a different acquisition cost.
Retail and e-commerce. Growth is still double-digit, just slower than the region. Indonesia's government is targeting about Rp 40 trillion in Harbolnas transactions for December 10–16, 2026, up from Rp 36.4 trillion in 2025, Investortrust reports. For turning targets into a channel budget, see our 2027 marketing budget worked example.
Banks, fintechs and insurers. Indonesia has 17 digital banks, the most in SEA-6, and the report calls them the region's profitability leaders thanks to lower cost-to-income ratios and disciplined credit risk. With lending growth slowing to 22%, borrower quality matters more than application volume. See our digital marketing playbook for banks.
Travel and mobility. At 6% and 10% growth, the market won't lift every player. Judge budgets on cost per booking, not on market expansion.
Advertisers in general. The 28% online media rise is media services revenue. It can't predict next year's CPMs on Google or Meta.
On AI, the report says 37% of consumer journeys in Indonesia begin with AI, and 84% of AI users are open to letting an AI agent find the best price and complete a purchase (SEA-6: 75%), assuming the assistant is reliable. The traffic effect already shows in Google AI Overviews, and an AI visibility audit shows where your brand stands.
What doesn't GMV tell you?
GMV is the gross value of transactions through platforms, before costs. On our reading of the definition, US$119 billion is neither platform revenue nor profit.
Four limits coverage often misses:
- The 2026 number is still a projection, since the year isn't over.
- Digital financial services are excluded. Digital payments value (US$595 billion) is counted separately and can't be added to GMV.
- 2025 growth changed between editions: total from +14% to +15%, e-commerce from +14% to +18%. Compare within one edition.
- The Indonesian-language PDF labels some charts "$M". The English version's US$ billion is correct.
idEA chair Budi Primawan, quoted by Investortrust, said Harbolnas success isn't measured by transaction value alone, but also by MSME readiness, local product reach and service quality.
Three questions for your team or agency this week
Take two numbers into your 2027 budget meeting: 16% e-commerce growth and AI use of 1.8 sessions a week. Then ask three questions.
- What's our online growth target against a 16% market? If it's well above that, ask which channels win the extra share, at what cost per acquisition (CPA).
- Which edition do the market figures in our deck come from? If anyone compares US$99 billion with US$119 billion, redo it on the US$102 billion base.
- Do AI assistants describe our products correctly? If no one has checked, do it in Q1, before adding ad budget.
Frequently asked questions
How big is Indonesia's digital economy in 2026, according to e-Conomy SEA?
e-Conomy SEA 2026 projects Indonesia's digital economy GMV at US$119 billion in 2026, up 16% from US$102 billion in 2025. It's still a projection, and it covers only e-commerce, online travel, online media, and mobility and food, leaving out digital financial services.
Which digital sector is growing fastest in Indonesia?
Online media, up 28% to US$12 billion in 2026. E-commerce follows at 16%, then mobility and food at 10%, with online travel slowest at 6%. For media, the report counts revenue from ads, games and streaming, which isn't the same as advertiser spend.
What is GMV, and how is it different from revenue?
GMV (gross merchandise value) is the gross value of transactions that pass through digital platforms, before costs. It isn't platform revenue, let alone profit. The exception is online media, where the report treats GMV as revenue. Read GMV as a measure of market scale, not of profitability.
Who publishes e-Conomy SEA, and when was the 2026 edition released?
Google and Temasek have run the research since 2016, with Bain & Company as lead research partner since 2019. Its 11th edition, Building the intelligent economy, came out on October 21, 2026, as a regional report plus separate country reports, including Indonesia.
Why does the 2025 figure differ between the 2025 and 2026 editions?
Last year's edition put Indonesia's 2025 GMV at US$99 billion, while the 2026 edition uses US$102 billion for the same year. That figure was revised, as were the e-commerce, travel, and mobility and food baselines. To calculate growth, take both numbers from one edition.
Want to test whether your 2027 growth targets hold up against these market numbers? Our Performance Marketing team can build channel budget scenarios with the cost assumptions spelled out.